Data Analytics
Data in its raw form will not tell you a story. Only by analysing the data, you will get deep insights and predict the future. Leverage on our data expertise and get bite-sized information that is relevant to you.
Data Warehouse
Store and Transform Disparate Data to guide management decisions
A data warehouse stores, collects and converts your data from a variety of sources into a consistent format and made available to end-users across the organisation in a shared platform. A uniform format ensures that the data is easily understood and ideal for ad-hoc analysis..
Herd data from multiple source systems into a single location.
A sole data house enables easy relocation and sharing of data.
Uniform data structure facilities consistent and accurate analysis.
Effortless data management as data is automatically converted and channelled.
Where the magic happens
In constructing your Data Warehouse, we will integrate all your different data sources (Finance, Sales, Supply Chain etc) into a comprehensive platform through our Extract, transform and load (ETL) process
Stage 1
Data Extraction
Data is extracted from their sources into a staging area.
Stage 2
Data Conversion
Data is converted into a
consistent format and structure.
Stage 3
Data Loading
Data is converted into a
consistent format and structure.
Stage 4
Building Summary Tools
Develop pre-calculated summary values to speed up report generation.
Stage 5
Obtain Reporting Tools
Develop pre-calculated summary values to speed up report generation.
Stage 6
Publish Your Shared Platform
A shared platform will allow users across your organisation access to the data.
Data Cleanse
Rationalize, update and upkeep your data with us.
Data ages rapidly. Every year, up to 40% of the data in a database expire as firms move locations, merge and are acquired, point-of-contacts change and many more. A contaminated database can easily cost thousands of dollars a year, wasting marketing money and sales time.
Seamless
Integration
No more manual work – get updates to your database automatically. All our data can be linked to the most commonly used CRMs or ERPs.
Stay
Up-To-Date
Automated updates provide the most recent data truth about your customers, suppliers and prospects in all your systems.
Relevant
Insights
Data can get overwhelming – getting dumped with the entire database will not be practical. Customise and obtain only the relevant data you want to receive.
Business Intelligence
Detect Industry Trends and Performance Gaps.
Transform senseless data into actionable business insights.
Business Intelligence has the potential to unearth a wealth of growth opportunities that were previously untapped or underserved. By converting disarrayed data into a visual context, you will be more perceptive of subtle differences and outliers that will not have been noticeable in its raw form.
Data Visualisation
Data Relevance
Dashboard Enabled
The functionality of the dashboard empowers you to freely 'zoom in' or expand on the scope of their analysis by adjusting the rules and conditions on the dashboard.
Predictive Analytics
Predict Future Trends With Past Insights
By leveraging on historical data to forecast trends, we can help you with corporate decision-making, key strategy conception and manage your risks. The true strength of predictive and advanced analytics is in that it enables you to formulate ahead in lieu of reacting to market changes as it happens.
Be First To
Detect Trends
Leverage on
Artificial Intelligence & Machine Learning
Guide Risk Management & Marketing Decisions
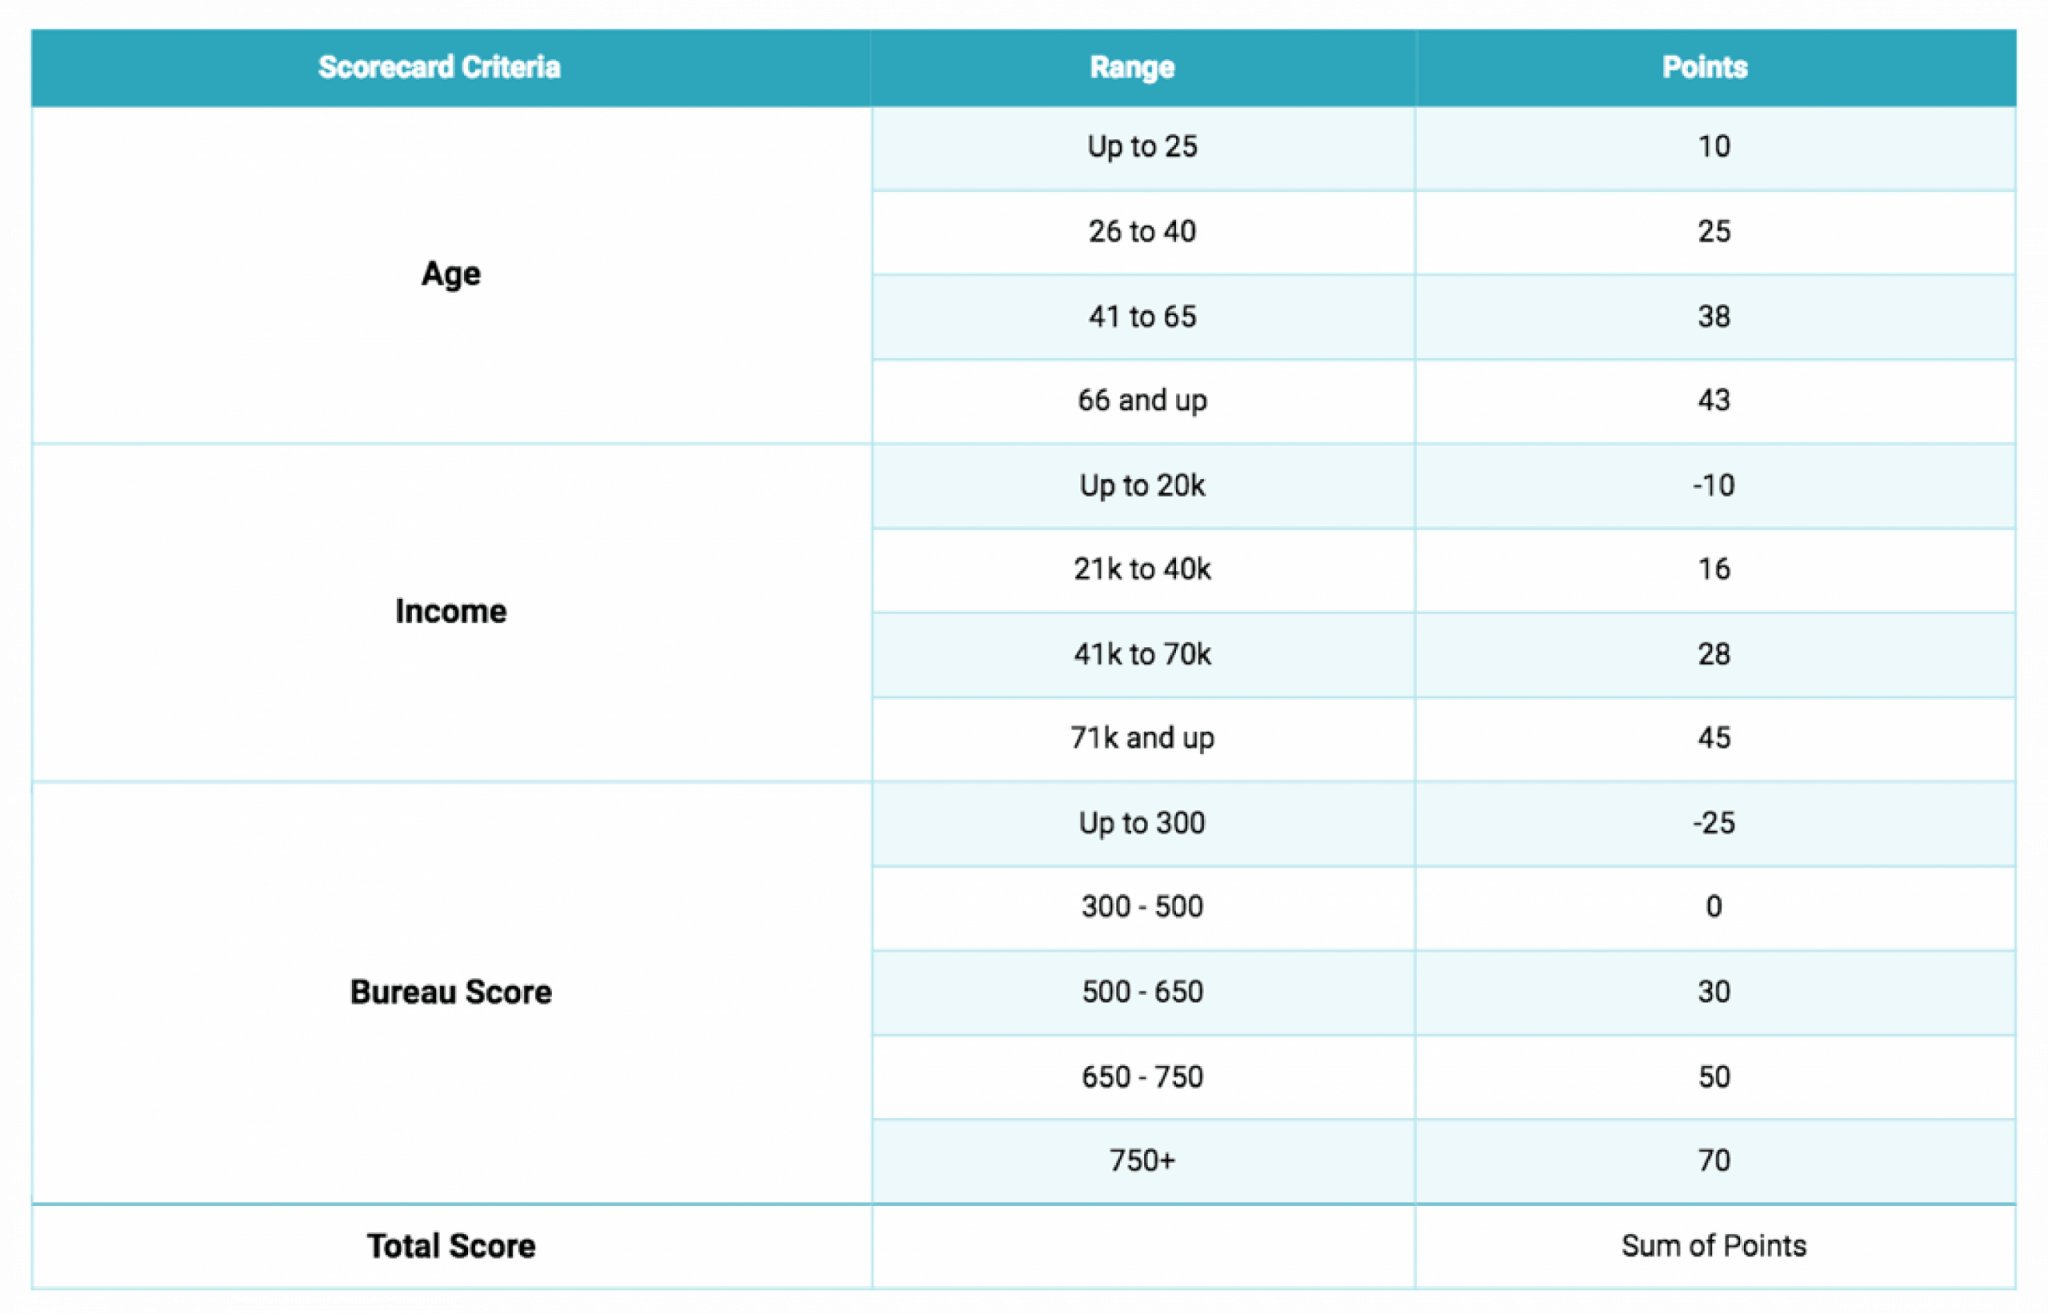
Scorecard: Getting An Overview
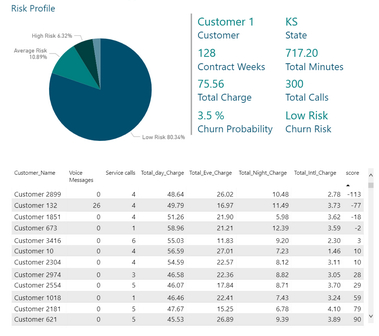
A scorecard is a graphical representation of the progress over time toward a specified goal. They are invaluable tools for organisations that offer an overview of the current performance and the distance before the goal – information that is useful to devise appropriate strategies and make strategic decision at that precise stage.
Customisable scorecards ensure higher relevance and accuracy of the insights for your business.
Heat Map : Hot and Cold
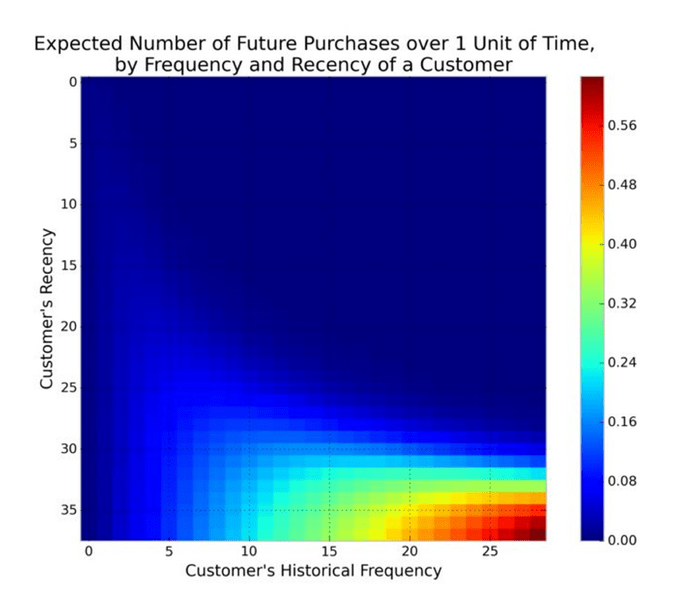
A heat map uses a system of color-coding to represent varying values to deliver a visually intuitive graphical representation that illustrates ‘hot’ and ‘cold’ zones/spots. ‘Hot’ spots (in red) typically represents high trigger elements and vice versa for ‘cold’ spots (in blue). They are an effective tool in identifying correlation between events which can provide indispensable insights in formulating potent strategies.
Risk Analytics
Where instincts are fallible, reliably manage risk by using a range of techniques and tools to extrapolate insights necessary to make informed decisions. Risk management analytics quantifies, measures and predict risk with a great degree of certainty – vital to support and manage your risk exposure across your organisation.
Marketing Analytics

Open the doors to enhanced marketing tools using analytics.
- Lead Scoring Model
- Market Segmentation
- Demand Forecast
- Customer Churn Prevention